As we move into winter in the Northern Hemisphere and the days shorten and the temperature drops, your thoughts might turn to warmer, sunnier places. Ah, yes, a place like Puerto Rico! Tropical breezes, wonderful beaches, and—at the fore of our mind—turtlefat (Auerodendron pauciflorum)! This cool little plant from the northern part of the island is highly endangered, with just a couple dozen individuals known to exist over some 200,000 acres. It is protected under the Endangered Species Act (ESA), and part of that protection means monitoring the places it livesso we know how the species and its habitat are faring. This is easier said than done: how can we monitor habitat for turtlefat or the hundreds of other ESA-listed species threatened by habitat loss, in the face of limited budgets for our wildlife agencies?
Fortunately, advances in technology provide one solution. At the Center for Conservation Innovation (CCI) at Defenders, we are using machine learning and satellite imagery to improve monitoring effectiveness and efficiency under the ESA. As satellite images of the Earth are constantly being collected, free satellite and remote sensing data has become increasingly accessible to conservationists. Using this abundance of satellite and remote sensing data, we developed a cost-efficient tool to automatically detect and document changes in habitats.
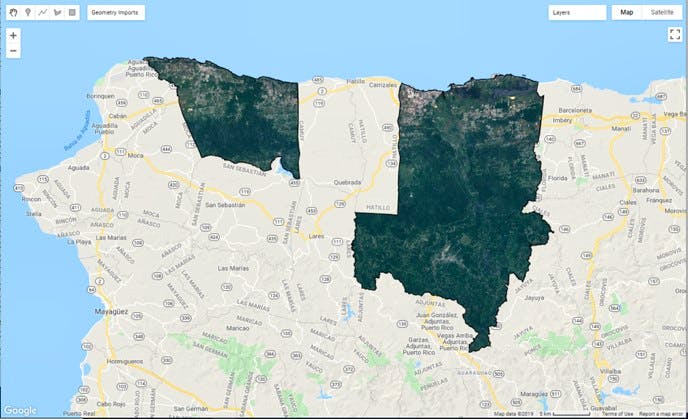
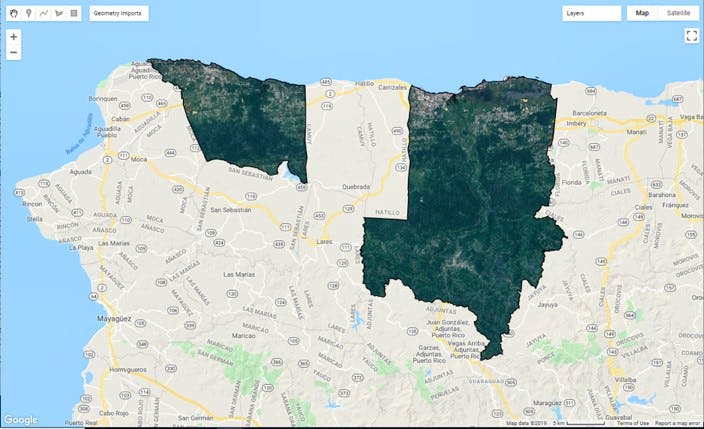
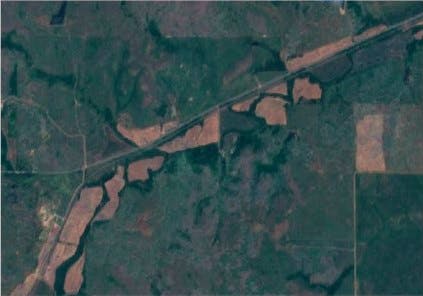
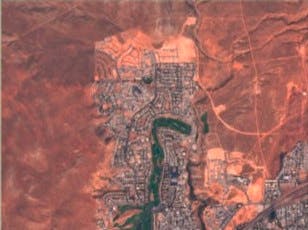
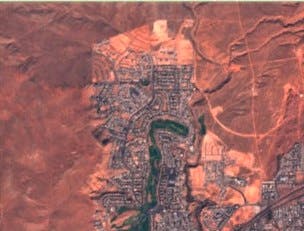
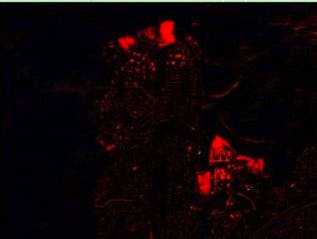
Using Google Earth Engine, we can compare satellite images of a particular area over two time periods and identify visible changes. For example, the figure below shows an increase in the number of oil well pads over time in a 17,300 acre grassland plot in Snyder, Texas The “before” photo (left) shows satellite imagery of the plot before February 1, 2017, and the “after” photo (center) shows satellite imagery of the plot 3 months later. Comparing these photos, we can see the addition of many oil well pads in just this 3 month period. The algorithm we have created automatically identifies areas of habitat loss (right, shown in red). Oil and gas development poses threats to sensitive grassland species, such as the endangered San Joaquin kit fox and blunt-nosed leopard lizard -- and the ability to identify changes in their habitat is critical to their recovery.

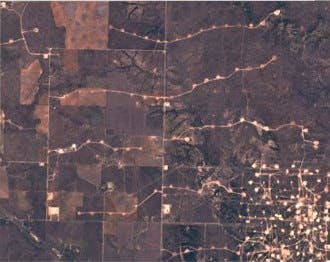

Habitat disturbances come in many forms – from oil well pads to clear-cut forests to agriculture plots and other incursions – and satellite imagery of these disturbances may look different in different types of habitat. To ensure our algorithm can accurately detect change in any given area – forest, grassland, desert, shrub, or wetland – we are identifying changes and collecting training data at multiple sites encompassing a wide variety of habitat and disturbance types. For instance, after comparing the two images, we identified and marked new oil well pads and are using this data to train our algorithm to find similar changes in other places, like below in Kansas, home to the endangered whooping crane, and Utah, home to the threatened Utah prairie dog.

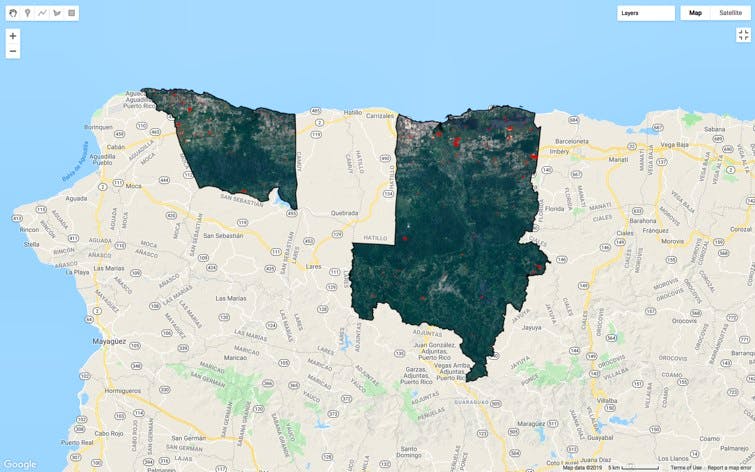
![(c) CCI’s automated change detection tool showing areas of habitat change in red. {This shows [activity] affecting habitat.}.jpg](https://defendersofwildlife-360365372.imgix.net/sites/default/files/2019-12/%28c%29%20CCI%E2%80%99s%20automated%20change%20detection%20tool%20showing%20areas%20of%20habitat%20change%20in%20red.%20%7BThis%20shows%20%5Bactivity%5D%20affecting%20habitat.%7D.jpg?fit=max&ixlib=php-4.1.0&w=2000)
This tool to detect habitat change in near-real time – without leaving your desk – has the ability to remarkably improve and even enable monitoring and enforcement efforts, increasing the overall effectiveness of the ESA. Many endangered species have very large ranges, and, in turn, sufficient monitoring of their critical habitat requires covering a lot of ground. In-person, on-the-ground habitat monitoring efforts of turtlefat’s habitat would need to cover over 200,000 acres! (The extent may change with the completion of refined range mapping). Instead, by using the automated change detection tool, areas of habitat loss across this range can immediately be identified while considerably reducing the time, labor, and funds previously necessary to identify habitat loss within endangered species ranges. This tool will help ensure that future recovery efforts are focused, critical, and strategic. Defenders plans to make this tool available to conservationists and the public in the near future, with hopes of improving policy and closing gaps in the biodiversity conservation.